


If your engineering team has been leaning on Atlassian Compass for a free, native baseline of delivery metrics, the ground just shifted under you. The good news: you do not need an enterprise platform, a migration project, or a per-seat contract to keep measuring how fast your team ships. You can do it right inside the Confluence pages your team already reads.
This post explains what changed, who it leaves behind, and how the new Engineering Reporting macros in GitHub Links for Confluence by Move Work Forward give small and mid-market teams a practical, included, privacy-first way to track DORA-style delivery metrics - without leaving Confluence.
What just changed: the DX acquisition and Compass moving to DX
Two announcements reset the landscape for engineering metrics inside the Atlassian ecosystem.
First, Atlassian acquired DX, the engineering-intelligence platform, signaling a clear move toward a premium, enterprise-grade analytics offering.
Second, Atlassian announced the next chapter for Compass: Compass is moving to DX. The free, native DORA baseline that many smaller teams quietly relied on is being folded into an enterprise direction (DX Fabric) rather than continuing as a lightweight, self-serve option.
For large enterprises with the budget and the appetite for a dedicated engineering-intelligence platform, that is a reasonable path. For everyone else, it raises an awkward question: what now?
Who gets left behind: SMB and mid-market engineering teams
Enterprise engineering-intelligence platforms are built for organizations with dozens or hundreds of engineers, dedicated platform teams, and budgets to match. They are powerful - and they are priced and scoped accordingly.
That is exactly the wrong fit for a 5-, 15-, or 40-person engineering org that simply wants to answer a few honest questions:
- Are our pull requests moving through review at a healthy pace?
- How much are we actually shipping week to week?
- Are reviews becoming a bottleneck?
Small and mid-market teams that used Compass for a "good enough" baseline are now caught in the middle. They do not want to stand up a separate analytics platform, negotiate per-seat pricing, or run a migration. They just want their delivery metrics back - ideally somewhere the whole team already looks.
That somewhere is Confluence.
What "good enough" delivery metrics actually look like
You do not need a 30-metric dashboard to run a healthy team. For most SMB and mid-market teams, a focused set of DORA-style delivery metrics answers the questions that matter:
- PR cycle time - how long a pull request takes from open to merge. The single best signal of delivery flow.
- PR throughput - how many PRs your team merges over a period. The pulse of output.
- Review latency - how long PRs wait for review. The most common hidden bottleneck on small teams.
These are team-level signals about flow and throughput, not a stopwatch on individuals. The goal is to see how work moves through your team, spot bottlenecks early, and have grounded conversations in retros - not to rank developers.
Introducing Engineering Reporting: three macros, live on the page
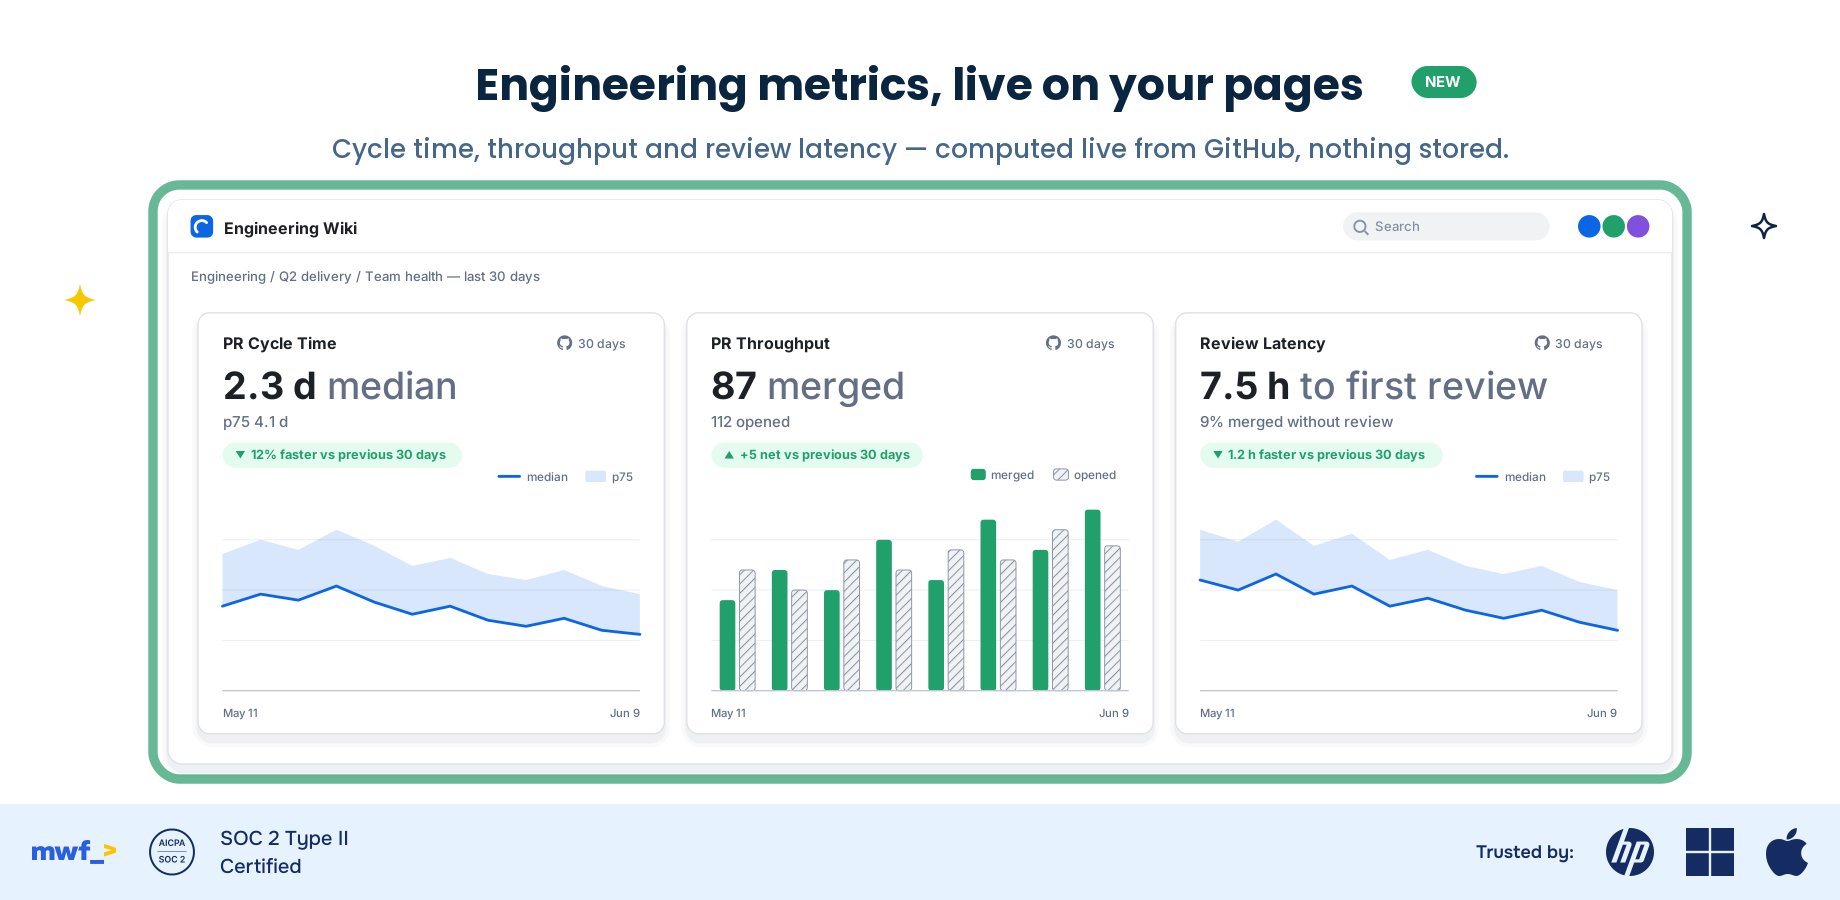
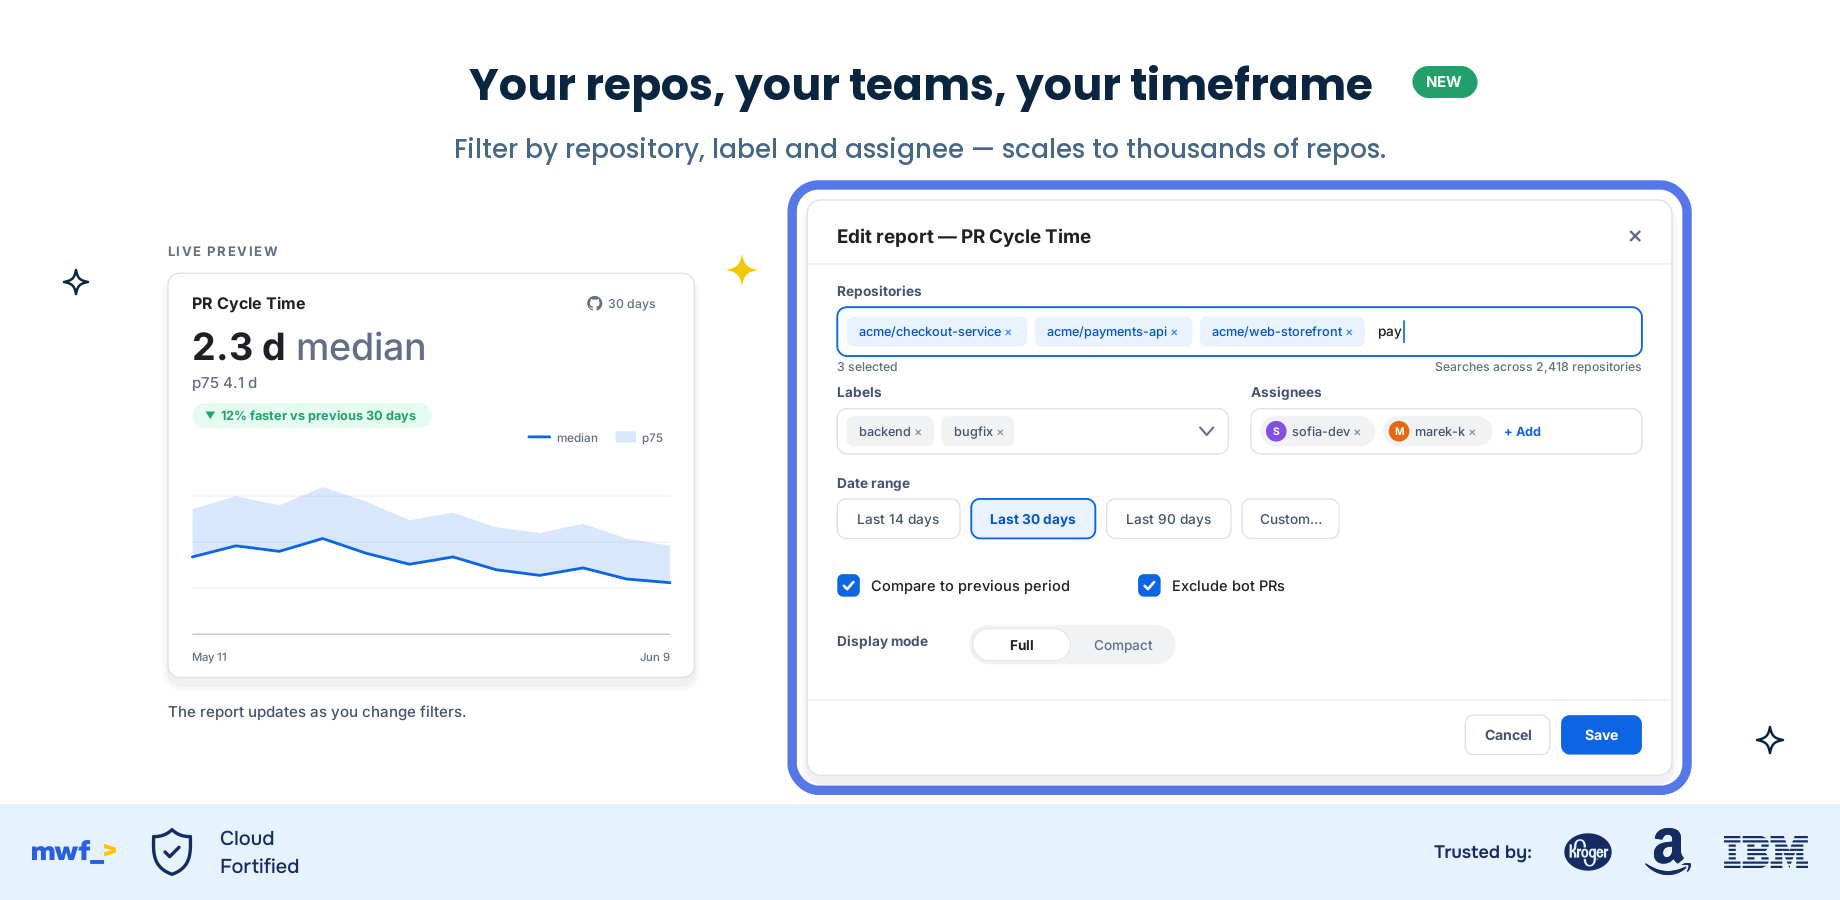
The new Engineering Reporting feature in GitHub Links for Confluence adds three macros you drop straight onto a Confluence page. Each renders live, team-level GitHub delivery metrics:
- PR Cycle Time - median time from PR open to merge for your team, over the period you choose.
- PR Throughput - the count of merged PRs across your selected repositories and timeframe.
- Review Latency - how long PRs wait before a first review, so you can catch review bottlenecks before they slow the whole team.
Everything is computed live from the GitHub API at render time. There is no overnight batch job, no separate dashboard to maintain, and no stale data sitting in another tool.
In-context, included, and nothing stored
Three things make this different from both the enterprise platforms and the lightweight repo-activity widgets.
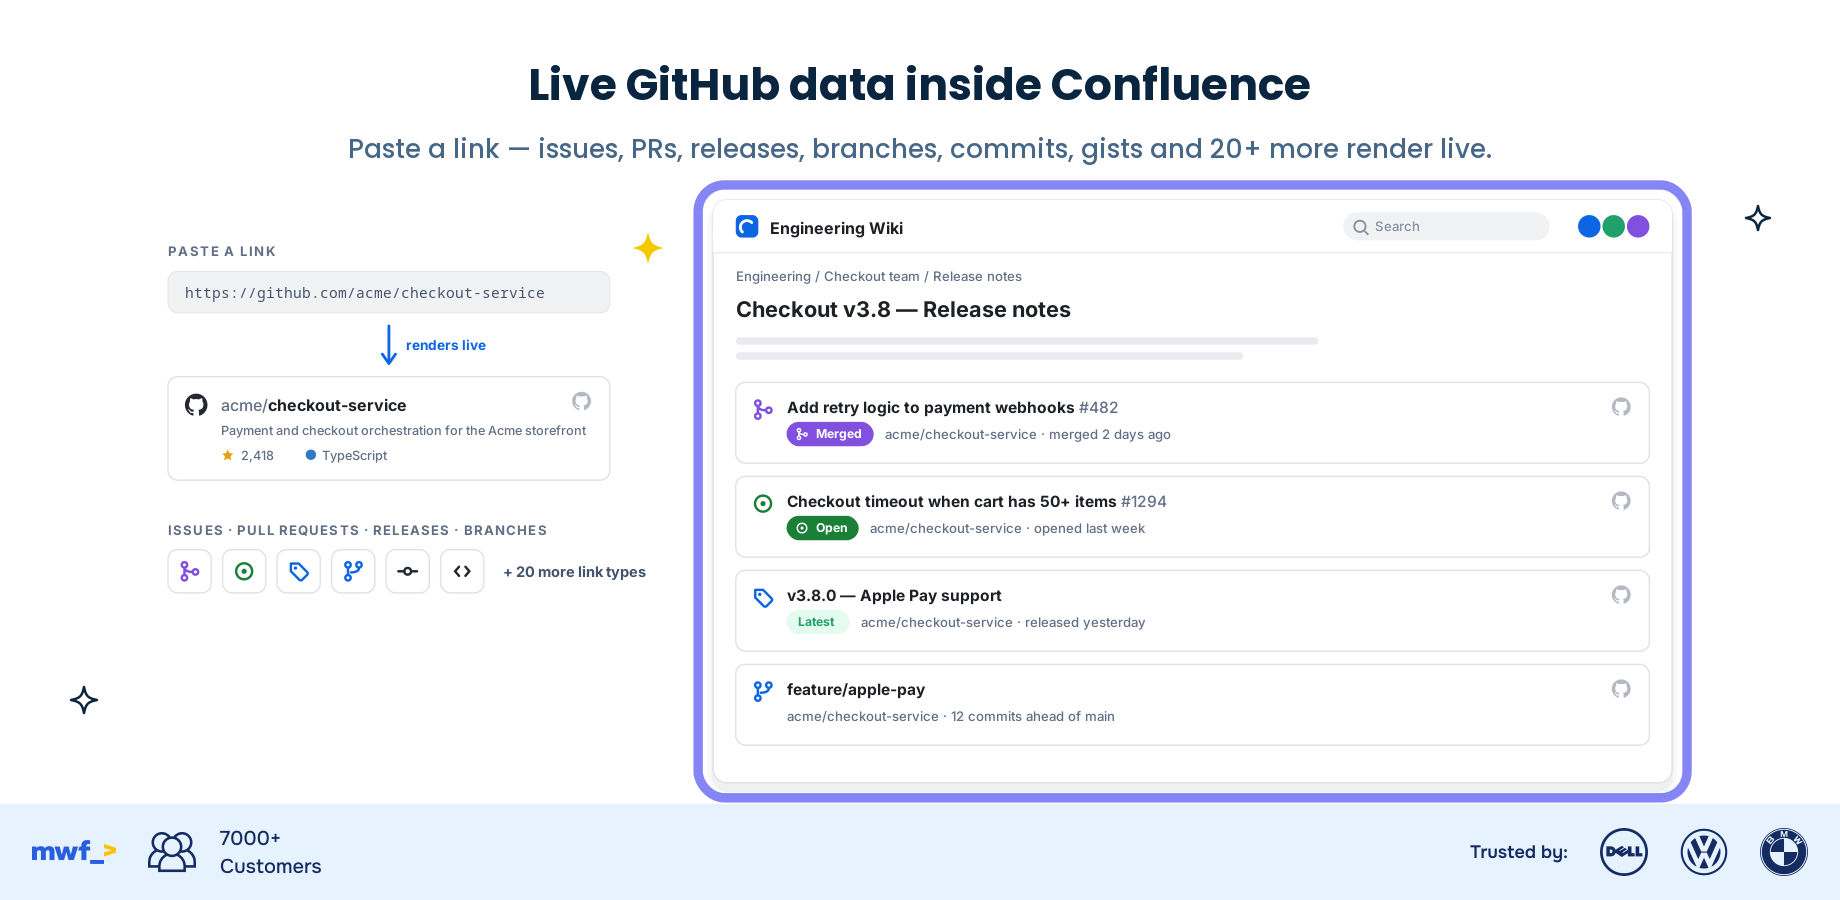
In-context. Your metrics live on the same Confluence pages as your runbooks, sprint notes, and team docs. No context-switching to a separate analytics tool. The numbers show up where the conversation already happens.
Included. Engineering Reporting is included in GitHub Links for Confluence at the standard subscription. There is no separate platform to buy and no per-seat metrics tax. If you have the app, you have the macros.
Private by design - we store no code or PR data. The macros compute metrics live from the GitHub API and reuse the existing GitHub connection you already configured. We do not store your code or your PR data. Nothing about your repositories is copied into a third-party datastore to power these charts.
That combination - in-context, included, and storing nothing - is hard to find. Enterprise platforms store and re-process your data and charge enterprise prices. Repo-activity widgets show raw commit counts but not real cycle-time metrics. This sits in the practical middle that small teams actually need.
Set it up in 3 steps
If you already use GitHub Links for Confluence, you are most of the way there.
- Install or open GitHub Links for Confluence from the Atlassian Marketplace listing and confirm your existing GitHub connection.
- Add an Engineering Reporting macro to any Confluence page - PR Cycle Time, PR Throughput, or Review Latency - and point it at the repositories and timeframe you care about.
- Publish the page. The macro renders live, team-level metrics on the spot. Add it to your team home page or sprint retro doc so the numbers are always one click away.
Full instructions are in the setup guide.
Moving from Data Center to Cloud? An easy win
If you are still on Confluence Data Center and weighing a move to Cloud, this is one more reason to make the jump a good one. Engineering Reporting is a Cloud feature, so migrating unlocks DORA-style delivery metrics on your pages as part of the same app you are already standardizing on.
Our Atlassian migration guide walks through what to expect when moving Move Work Forward apps from Data Center to Cloud, so you can land with your metrics ready to go.
Get your delivery metrics back - in Confluence
Compass moving to DX does not have to mean a migration project or an enterprise contract. For SMB and mid-market teams, the practical answer is already here: DORA-style delivery metrics, live on the Confluence pages your team already uses, included in an app you may already have, with nothing stored.
- Try it free: Add GitHub Links for Confluence from the Atlassian Marketplace and turn on Engineering Reporting.
- See the product: Explore GitHub Links for Confluence.
- Read the guide: Follow the setup documentation to get your first macro on a page in minutes.
Keep your team's delivery metrics where the work already happens.